问题陈述:为运输公司建立一个预测模型, 以找到一艘船需要多少船员的估计。
数据集包含159个具有9个特征的实例。
数据集描述如下:
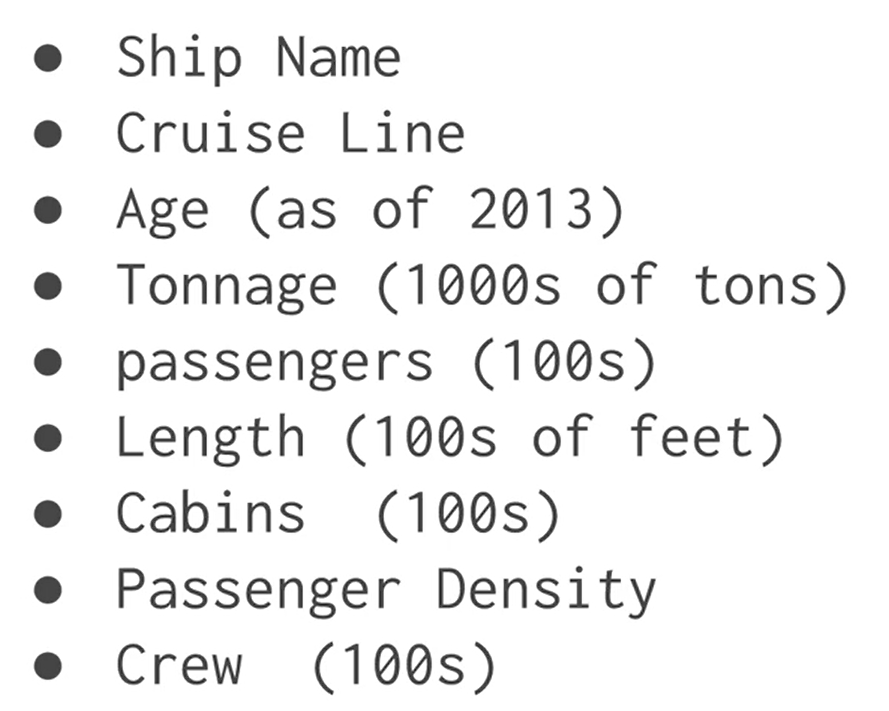
让我们建立线性回归模型, 预测机组人员
附加数据集:cruise_ship_info
import pyspark
from pyspark.sql import SparkSession
#SparkSession is now the entry point of Spark
#SparkSession can also be construed as gateway to spark libraries

#create instance of spark class
spark = SparkSession.builder.appName( 'housing_price_model' ).getOrCreate()

#create spark dataframe of input csv file
df = spark.read.csv( 'D:\python coding\pyspark_tutorial\Linear regression\cruise_ship_info.csv'
                   , inferSchema = True , header = True )
df.show( 10 )
输出:
+-----------+-----------+---+------------------+----------+------+------+-----------------+----+
| Ship_name|Cruise_line|Age| Tonnage|passengers|length|cabins|passenger_density|crew|
+-----------+-----------+---+------------------+----------+------+------+-----------------+----+
| Journey| Azamara| 6|30.276999999999997| 6.94| 5.94| 3.55| 42.64|3.55|
| Quest| Azamara| 6|30.276999999999997| 6.94| 5.94| 3.55| 42.64|3.55|
|Celebration| Carnival| 26| 47.262| 14.86| 7.22| 7.43| 31.8| 6.7|
| Conquest| Carnival| 11| 110.0| 29.74| 9.53| 14.88| 36.99|19.1|
| Destiny| Carnival| 17| 101.353| 26.42| 8.92| 13.21| 38.36|10.0|
| Ecstasy| Carnival| 22| 70.367| 20.52| 8.55| 10.2| 34.29| 9.2|
| Elation| Carnival| 15| 70.367| 20.52| 8.55| 10.2| 34.29| 9.2|
| Fantasy| Carnival| 23| 70.367| 20.56| 8.55| 10.22| 34.23| 9.2|
|Fascination| Carnival| 19| 70.367| 20.52| 8.55| 10.2| 34.29| 9.2|
| Freedom| Carnival| 6|110.23899999999999| 37.0| 9.51| 14.87| 29.79|11.5|
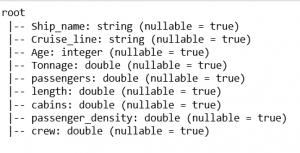
+-----------+-----------+---+------------------+----------+------+------+-----------------+----+#prints structure of dataframe along with datatype
df.printSchema()输出:
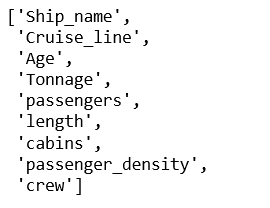
#In our predictive model, below are the columns
df.columns
输出:
#columns identified as features are as below:
#['Cruise_line', 'Age', 'Tonnage', 'passengers', 'length', 'cabins', 'passenger_density']
#to work on the features, spark MLlib expects every value to be in numeric form
#feature 'Cruise_line is string datatype
#using StringIndexer, string type will be typecast to numeric datatype
#import library strinindexer for typecasting

from pyspark.ml.feature import StringIndexer
indexer = StringIndexer(inputCol = 'Cruise_line' , outputCol = 'cruise_cat' )
indexed = indexer.fit(df).transform(df)

#above code will convert string to numeric feature and create a new dataframe
#new dataframe contains a new feature 'cruise_cat' and can be used further
#feature cruise_cat is now vectorized and can be used to fed to model
for item in indexed.head( 5 ):
     print (item)
     print ( '\n' )
输出:
Row(Ship_name='Journey', Cruise_line='Azamara', Age=6, Tonnage=30.276999999999997, passengers=6.94, length=5.94, cabins=3.55, passenger_density=42.64, crew=3.55, cruise_cat=16.0)

Row(Ship_name='Quest', Cruise_line='Azamara', Age=6, Tonnage=30.276999999999997, passengers=6.94, length=5.94, cabins=3.55, passenger_density=42.64, crew=3.55, cruise_cat=16.0)

Row(Ship_name='Celebration', Cruise_line='Carnival', Age=26, Tonnage=47.262, passengers=14.86, length=7.22, cabins=7.43, passenger_density=31.8, crew=6.7, cruise_cat=1.0)

Row(Ship_name='Conquest', Cruise_line='Carnival', Age=11, Tonnage=110.0, passengers=29.74, length=9.53, cabins=14.88, passenger_density=36.99, crew=19.1, cruise_cat=1.0)

Row(Ship_name='Destiny', Cruise_line='Carnival', Age=17, Tonnage=101.353, passengers=26.42, length=8.92, cabins=13.21, passenger_density=38.36, crew=10.0, cruise_cat=1.0)
from pyspark.ml.linalg import Vectors
from pyspark.ml.feature import VectorAssembler
#creating vectors from features
#Apache MLlib takes input if vector form
assembler = VectorAssembler(inputCols = [ 'Age' , 'Tonnage' , 'passengers' , 'length' , 'cabins' , 'passenger_density' , 'cruise_cat' ], outputCol = 'features' )
output = assembler.transform(indexed)
output.select( 'features' , 'crew' ).show( 5 )
#output as below输出:
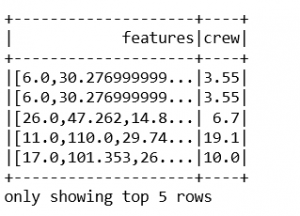
#final data consist of features and label which is crew.
final_data = output.select( 'features' , 'crew' )
#splitting data into train and test
train_data, test_data = final_data.randomSplit([ 0.7 , 0.3 ])
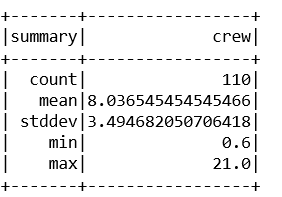
train_data.describe().show()输出:
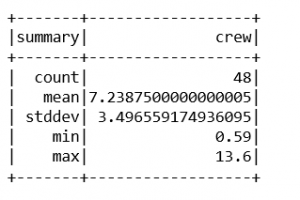
test_data.describe().show()输出:
#import LinearRegression library
from pyspark.ml.regression import LinearRegression
#creating an object of class LinearRegression
#object takes features and label as input arguments
ship_lr = LinearRegression(featuresCol = 'features' , labelCol = 'crew' )
#pass train_data to train model
trained_ship_model = ship_lr.fit(train_data)
#evaluating model trained for Rsquared error
ship_results = trained_ship_model.evaluate(train_data)
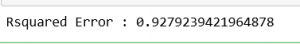
print ( 'Rsquared Error :' , ship_results.r2)
#R2 value shows accuracy of model is 92%
#model accuracy is very good and can be use for predictive analysis输出:
#testing Model on unlabeled data
#create unlabeled data from test_data
#testing model on unlabeled data
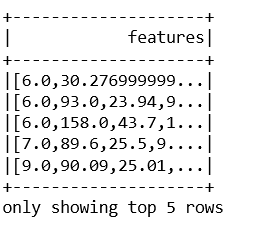
unlabeled_data = test_data.select( 'features' )
unlabeled_data.show( 5 )输出:
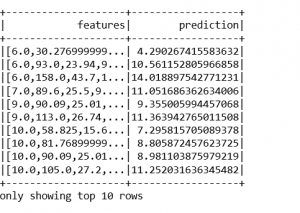
predictions = trained_ship_model.transform(unlabeled_data)
predictions.show()
#below are the results of output from test data
输出:
首先, 你的面试准备可通过以下方式增强你的数据结构概念:Python DS课程。
来源:
https://www.srcmini02.com/70518.html


